Business Intelligence
Big Picture
We use interactive data exploration dashboards leveraging Microsoft Power BI to allow our clients to see the big picture of their operations. Clients can see at a glance what their biggest problem areas are before deciding to drill down into the details.
Drilling Down
The dashboards are all about interactivity and visualization allowing our clients to drill into problem areas and answer questions with the data. Clients are given the autonomy to review their video and use the same tools to get details on specific sites down to the shift, line and other specifics to see what areas need action.
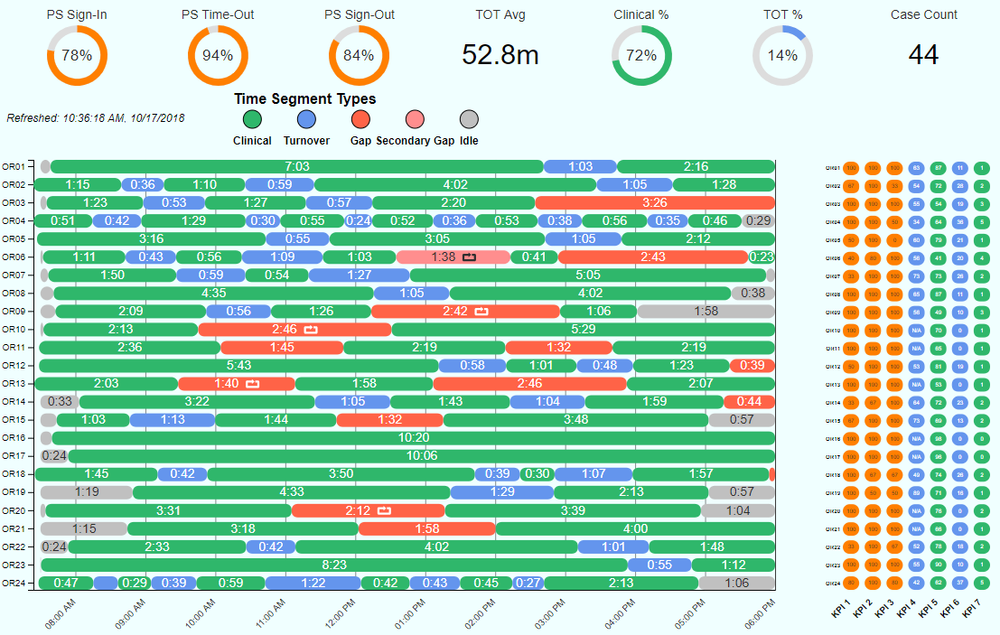
Near-Real-Time Feedback
We utilize near-real-time feedback boards to summarize large amounts of data. This is currently utilized in the healthcare industry where customers and management can at a glance see which of the hundreds of rooms in a hospital can accept a patient, or where medical isolation protocols need to be followed within a hospital campus.